Logging doesn’t suck because of tooling.
It sucks when logs are hard to read, hard to correlate, and lack context.
Most production issues aren’t solved by adding more logs, but by making existing logs easier to work with: easy to scan under pressure, easy to correlate to a single request, and easy to filter with basic tools like grep.

The site loggingsucks.com does a great job explaining why logging often fails in practice. This post builds on those ideas and adds a few concrete patterns that have worked well for me in real production systems.
Make logs easy to read
Logs are produced by machines, but they’re read by humans, usually under stress.
If logs aren’t easy to scan, they fail at their primary job.
Years ago, Heroku popularized the logfmt format. It strikes a great balance between machine-friendly and human-readable logs by using simple key=value pairs:
Your eyes can instantly pick out what matters, and machines can still parse everything reliably.
Use a consistent logging format
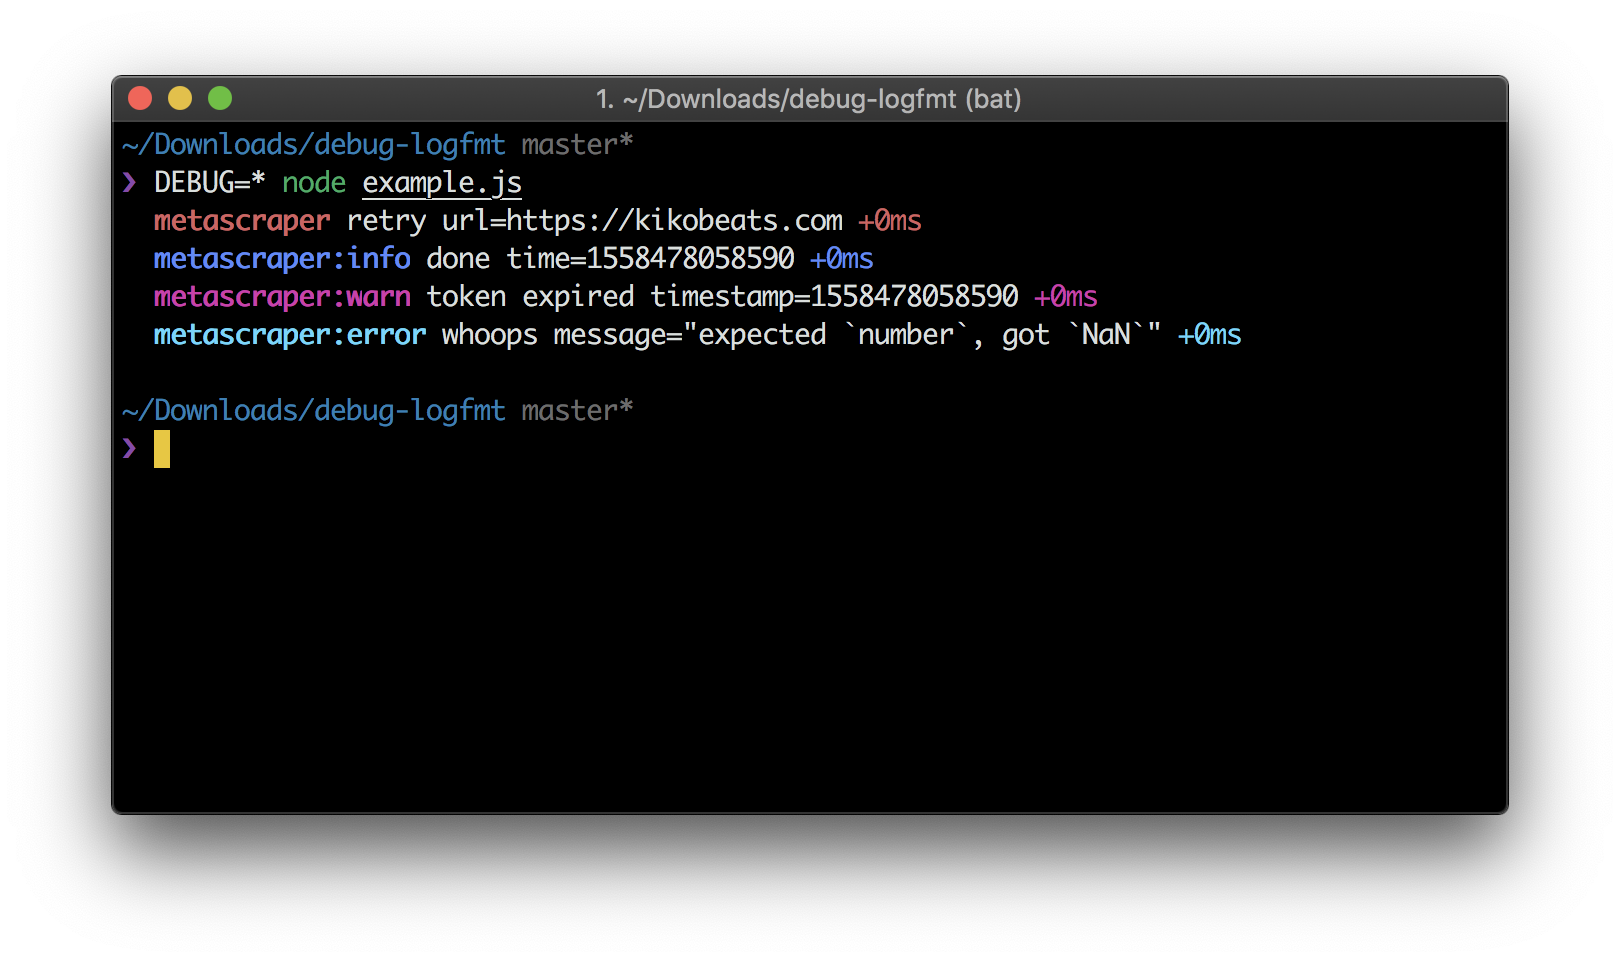
Because of that, I’ve standardized on logfmt for most of my projects using debug-logfmt. It writes logs to stdout/stderr using logfmt, while keeping the familiar debug API:
const debug = require('debug-logfmt')('metascraper')

debug('retry', { url: 'https://kikobeats.com' })
debug.info('done', { time: Date.now() })
debug.warn('token expired', { timestamp: Date.now() })
debug.error('whoops', { message: 'expected `number`, got `NaN`' })
This gives you structured logs, no JSON noise, and logs that are easy to read and grep.
There’s one more subtle detail worth pointing out. The output is colorized:
api:lightship signalReady limit=hard signal=ready
api address=http://[::]:3000/ environment=development node=24.11.1 status=listening version=3.18.78 duration=113ms
req-frequency requests=1 perMinute=1 perSecond=0.0
api:cache key=EXA4OVNWtQz url="https://x.com/verge/status/957383241714970624&force=" authorization="Bearer lEhTGCfOo6" accept-encoding="gzip, deflate, br" host=localhost:3000 connection=keep-alive
browserless:info create proxyServer=false retry=2 timeout=8861 concurrency=1 mem="374 MB" duration=16ms
html-get prerender url=https://x.com/verge/status/957383241714970624 state=success
api:html:info get url=https://x.com/verge/status/957383241714970624 statusCode=200 mode=prerender duration=3.7s
media logo input=https://abs.twimg.com/responsive-web/client-web/icon-ios.77d25eba.png url=input type=png size=13160 height=1024 width=1024 size_pretty="13.2 kB" duration=298ms
media image input=https://pbs.twimg.com/media/DRg1OMRVwAEuwTK.jpg url=input type=jpg size=175887 height=1080 width=1080 size_pretty="176 kB" duration=296ms
cacheable-response key=EXA4OVNWtQz isHit=false isExpired=true isStale=false result=false etag="2fb1-OFTturlbVqQ0NEljteW2CSCUGNA" ifNoneMatch=undefined isModified=true
cloudflare-purge files=https://c.microlink.io/EXA4OVNWtQz.json isFulfilled=true duration=197ms
api status=200 ip=::ffff:127.0.0.1 /?url=https%3A%2F%2Fx.com%2Fverge%2Fstatus%2F957383241714970624&force= duration=5.2s size="12 kB"
browserless:info close timeout=false concurrency=0 mem="453 MB" duration=3ms
Color improves log readability and visual pattern matching, not just in your terminal. Colorized ASCII output is widely supported and works across many environments, from local development to production tooling.
Prefix logs by request lifecycle
The hardest part of logging isn’t writing logs; it’s reading the right ones.
This becomes especially painful under high concurrency, where logs from many requests are interleaved.
When debugging a single request, you usually want to see everything related to that request, in order.
The simplest solution: prefix every log line with a request ID.
Automatically prefix stdout/stderr in Node.js
In Node.js, this is surprisingly easy using AsyncLocalStorage.
The idea is simple:
- Generate a UUID per request
- Store it in async context
- Automatically prefix everything written to stdout/stderr
Here’s a minimal implementation:
'use strict'

const { AsyncLocalStorage } = require('async_hooks')
const { randomUUID } = require('crypto')

const asyncLocalStorage = new AsyncLocalStorage()

const originalStdoutWrite = process.stdout.write
const originalStderrWrite = process.stderr.write

const overrideWrite = (stream, originalWrite) => {
  stream.write = function (data, encoding, callback) {
    const store = asyncLocalStorage.getStore()
    if (store && store.logs) {
      const uuidString = store.uuid ?? ''
      store.logs.push({ stream, originalWrite, data: uuidString + ' ' + data, encoding, callback })
    } else {
      const uuid = typeof store === 'object' ? store?.uuid : store
      const uuidString = uuid ?? ''
      originalWrite.call(stream, (uuidString ? uuidString + ' ' : '') + data, encoding, callback)
    }
  }
}

overrideWrite(process.stderr, originalStderrWrite)
overrideWrite(process.stdout, originalStdoutWrite)

const getStore = () => asyncLocalStorage.getStore()

const getUUID = () => {
  const store = getStore()
  return typeof store === 'object' ? store.uuid : store
}

const withUUID = fn => asyncLocalStorage.run({ uuid: randomUUID(), logs: [] }, fn)

const flush = ({ print = true } = {}) => {
  const store = getStore()
  if (store && store.logs) {
    if (print) {
      store.logs.forEach(({ originalWrite, stream, data, encoding, callback }) => {
        originalWrite.call(stream, data, encoding, callback)
      })
    }
    store.logs = null
  }
}

module.exports = { getUUID, withUUID, flush, getStore }
Once this is in place, every log line automatically carries context.
Attach the request ID early
You only need to wrap request handling once:
const { withUUID, getUUID, flush } = require('./uuid')

module.exports = (req, res, reqFrequency) =>
  withUUID(() => {
    // Since now, any stdout/stderr is prefixed by uuid

    // associate the id with the response
    onHeaders(res, () => {
      res.setHeader('x-request-id', req.id)
    })

    onFinished(res, () => {
      // print logs conditionally
      flush({ print: sampling({ req, res }) })
    })
  })
No need to pass IDs around manually. No need to remember to log them. Logs are buffered per request and only printed when the sampling policy decides they’re worth keeping.
Once logs are buffered per request, you can decide whether they should be printed at all. This is where sampling comes in.
The goal isn’t to keep every log line. In production, that quickly becomes noisy, expensive, and hard to reason about.
But more importantly, printing logs is an I/O operation, and I/O is slow: Every time you write to stdout/stderr, you’re consuming CPU cycles and potentially blocking your process. By printing less, your application becomes faster and more responsive.
Sampling strategy
Instead, as Boris commented in the original post, sampling allows you to keep the requests that matter while still retaining a representative view of normal traffic.
Here’s the sampling strategy I use:
'use strict'

const { isProduction, PING_TIMEOUT } = require('../constant')

// Randomly sample the rest to print 20%
const sampling = isProduction ? () => Math.random() < 0.2 : () => true

module.exports = ({ req, res }) => {
  // 1. Never log 429 (Too Many Requests) - too noisy.
  if (res.statusCode === 429) return false

  // 2. Always keep errors (4xx, 5xx).
  if (res.statusCode >= 400) return true

  // 3. Always keep slow requests.
  // Anything above your p99 latency threshold.
  if (req.timestamp() >= PING_TIMEOUT) return true

  // 4. Always keep specific users.
  // VIP customers, internal testing accounts, flagged sessions.
  if (req.isPro || req.query?.force) return true

  // 5. Otherwise, use the sampling
  return sampling()
}
The rules are intentionally simple:
- Errors are never dropped.
- Slow requests are always kept.
- Privileged or explicitly flagged requests get full visibility.
- Everything else is sampled at a low, fixed rate.
Because logs are buffered per request, this decision happens once, at the end of the request lifecycle. You can log freely during execution without worrying about volume or cost.
Sampling becomes a policy decision, not something every log statement has to think about.
What the output looks like
The result is clean, readable, and trivially filterable:
4206b33e-b040-4052-9931-dc11481c1fcf api:lightship signalReady limit=hard signal=ready
4206b33e-b040-4052-9931-dc11481c1fcf api address=http://[::]:3000/ environment=development node=24.11.1 status=listening version=3.18.78 duration=113ms
4206b33e-b040-4052-9931-dc11481c1fcf req-frequency requests=1 perMinute=1 perSecond=0.0
4206b33e-b040-4052-9931-dc11481c1fcf api:cache key=EXA4OVNWtQz url="https://x.com/verge/status/957383241714970624&force=" authorization="Bearer lEhTGCfOo6" accept-encoding="gzip, deflate, br" host=localhost:3000 connection=keep-alive
4206b33e-b040-4052-9931-dc11481c1fcf browserless:info create proxyServer=false retry=2 timeout=8861 concurrency=1 mem="374 MB" duration=16ms
4206b33e-b040-4052-9931-dc11481c1fcf html-get prerender url=https://x.com/verge/status/957383241714970624 state=success
4206b33e-b040-4052-9931-dc11481c1fcf api:html:info get url=https://x.com/verge/status/957383241714970624 statusCode=200 mode=prerender duration=3.7s
4206b33e-b040-4052-9931-dc11481c1fcf media logo input=https://abs.twimg.com/responsive-web/client-web/icon-ios.77d25eba.png url=input type=png size=13160 height=1024 width=1024 size_pretty="13.2 kB" duration=298ms
4206b33e-b040-4052-9931-dc11481c1fcf media image input=https://pbs.twimg.com/media/DRg1OMRVwAEuwTK.jpg url=input type=jpg size=175887 height=1080 width=1080 size_pretty="176 kB" duration=296ms
4206b33e-b040-4052-9931-dc11481c1fcf cacheable-response key=EXA4OVNWtQz isHit=false isExpired=true isStale=false result=false etag="2fb1-OFTturlbVqQ0NEljteW2CSCUGNA" ifNoneMatch=undefined isModified=true
4206b33e-b040-4052-9931-dc11481c1fcf cloudflare-purge files=https://c.microlink.io/EXA4OVNWtQz.json isFulfilled=true duration=197ms
4206b33e-b040-4052-9931-dc11481c1fcf api status=200 ip=::ffff:127.0.0.1 /?url=https%3A%2F%2Fx.com%2Fverge%2Fstatus%2F957383241714970624&force= duration=5.2s size="12 kB"
4206b33e-b040-4052-9931-dc11481c1fcf browserless:info close timeout=false concurrency=0 mem="453 MB" duration=3ms
You can now:
grepby request ID- Copy-paste a full request trace
- Correlate client errors with server logs instantly